


« Regatta: America’s Cup World Series 2013 Races begin in Naples, Italy | Main | DOCUMENTA MADRID: MAY 5 - May 12, 2013 »
April 25, 2013
Traffic Congestion Rising in USA, Declining in Europe

INRIX, a leading international provider of traffic information and driver services, today released its sixth Traffic Scorecard Annual Report, which revealed that traffic congestion in the USA is back on the rise in 2013 after two consecutive years of declines. In the first three months of this year, traffic congestion is up 4 percent compared to 2012. The uptick in traffic congestion in 2013 follows a 22 percent decrease in 2012.
U.S. Traffic Patterns & Worst Traffic Corridors
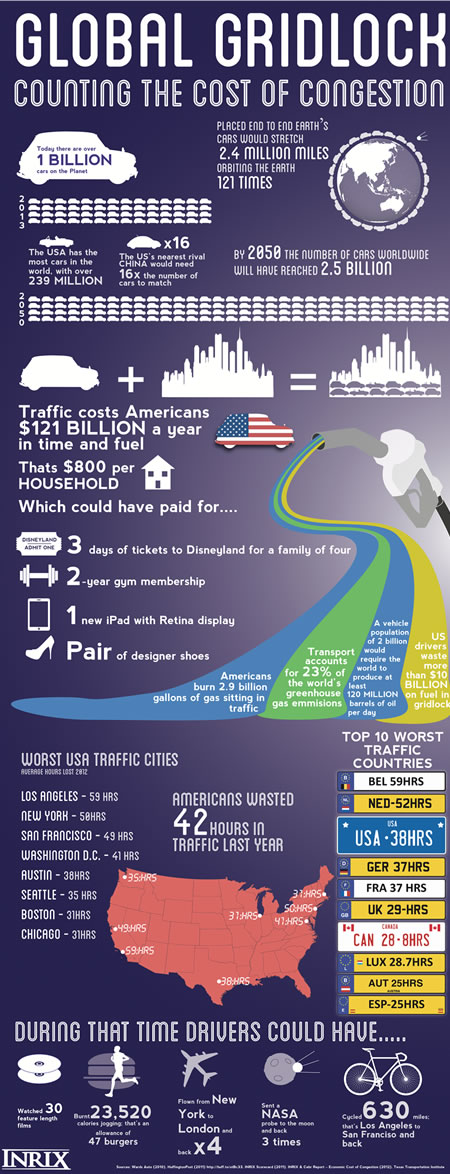
By analyzing traffic in USA’s 100 largest metropolitan areas in 2012, INRIX revealed that drivers wasted an average of 42 hours in America’s Top 10 Worst Traffic Cities - the equivalent to one week of vacation.
Top 10 Worst Cities for Traffic in America in 2012
RANK — CITY — HOURS LOST IN 2012
1 — Los Angeles — 59
2 — Honolulu — 50
3 — San Francisco — 49
4 — Austin, TX — 38
5 — New York — 50
6 — Bridgeport, CT — 39
7 — San Jose, CA — 31
8 — Seattle — 35
9 — Washington, D.C. — 41
10 — Boston — 31
Findings also exposed that drivers wasted an average of 62 hours last year on America’s most congested roads. The Top 10 Worst Roads for Traffic in 2012 were:
The Cross Bronx Expy (New York: I-95 SB) - Drivers on New York’s worst highway waste over six days each year in traffic.
The San Diego Fwy (L.A.: I-405 SB) - Consistently jammed in both directions, the 405 is LA’s worst freeway; the 8.1-mile stretch leading to Mullholland Dr. takes drivers over 50 minutes on Tuesday mornings - the worst day and time of the week.
The Van Wyck Expy (New York: I-678 SB) - On Thursdays between 4-5 p.m., drivers crawl at 10 mph, and it takes nearly 40 minutes to travel 6 miles.
The Santa Monica Fwy (L.A.: I-10 EB) - It can take drivers up to over an hour (63 min) to navigate the 15-mile stretch from Lincoln Blvd. to Alameda.
The Riverside Fwy (L.A.: CA-91 EB) - Drivers waste approximately six days per year in gridlock on this road.
The Long Island Expy (New York: I-495 EB) - New Yorkers waste more than a half hour per day on the evening commute in traffic on the L.I.E.
Brooklyn Queens Expy (New York: I-278 WB) - It takes approximately an hour to go 10 miles on this highway during the Tuesday evening commute.
San Diego Fwy (L.A.: I-405 NB) -A 13-mile stretch up to Getty Center Drive takes 40 minutes at a crawl of 20 mph.
The Dan Ryan/Kennedy Expy (Chicago: I-90/I-94 WB) - Chicago commuters waste approximately one work week (5 days) every year in traffic on this popular road to O’Hare Airport.
The Santa Ana/Golden St. Fwy (L.A. I-5 SB) - An 18-minute trip on this 17-mile stretch takes almost 50 minutes on weekday afternoons
Additionally, the Scorecard uncovered several other interesting trends regarding U.S. commute times during rush hour. According to INRIX, the worst times to be on the roads in terms of delay are weekday mornings between 7-8 a.m. and weekday evenings between 4-5 p.m. The busiest morning commute hour is Tuesday from 8-9 a.m., and the busiest evening commute takes place on Friday from 5-6 p.m.
Global Traffic Trends
While the Scorecard tells the story of rising traffic congestion indicative of a recovering economy, the report shows that, unlike the U.S., Europe traffic congestion is decreasing as the Eurozone continues to struggle through its debt crisis. Traffic congestion fell 18 percent across Europe in 2012 and continues to spiral downward in 2013 with a further 23 percent decline in the first quarter.
Aside from Luxembourg, the remaining 11 European countries analyzed in the report continue to show steep declines. Even Germany, the long-considered economic stalwart of the EU, showed declines in 2012.
COUNTRY — HOURS LOST IN 2012
Portugal — 11
Italy — 22
Luxembourg — 29
Spain — 25
Hungary — 16
United Kingdom — 29
Austria — 25
Netherlands — 52
Germany — 37
France — 37
Luxembourg has the largest increases in traffic with congestion up by 38 percent in 2013. Ireland is up 10 percent in the same period. Traffic congestion in Europe’s financial capital of London is up 23 percent in the first three months of 2013.
According to INRIX, after leveraging trillions of data points collected and archived by its Traffic Intelligence platform, the Scorecard publishes the most up-to-date information regarding overall congestion and the worst roads for traffic across America. By analyzing hundreds of thousands of road segments totaling nearly 2 million miles of major highways, arterials and city streets nationwide - with a special focus on the 100 largest U.S. metropolitan areas - the Scorecard informs the ongoing debate of one of the USA’s most frustrating and intractable issues — Traffic Congestion.
|GlobalGiants.Com|


Edited & Posted by the Editor | 11:33 AM | Link to this Post